Monthly aggregates from Sensi runtime + NOAA/IEM weather + Green Button kWh.
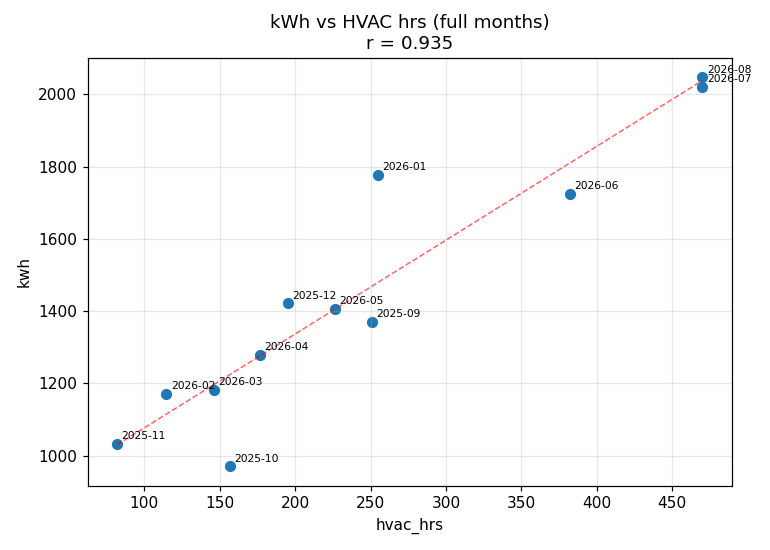
The strongest single predictor.
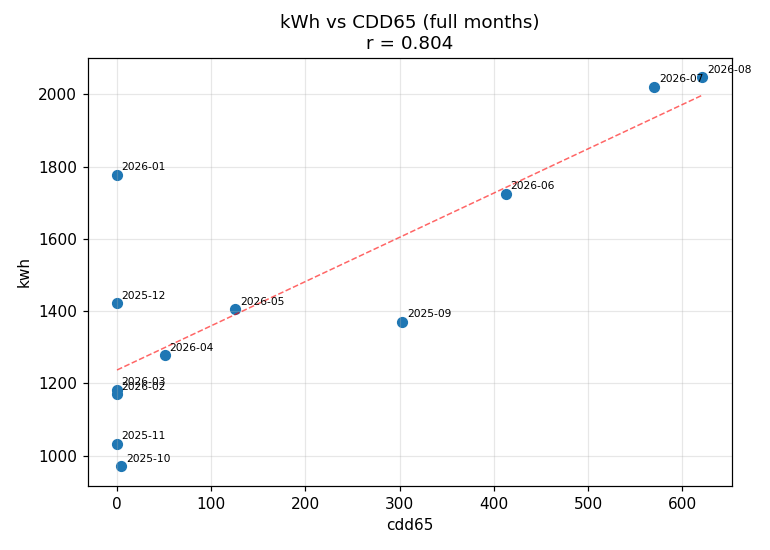
Cooling-only view: how much of the bill tracks summer heat.
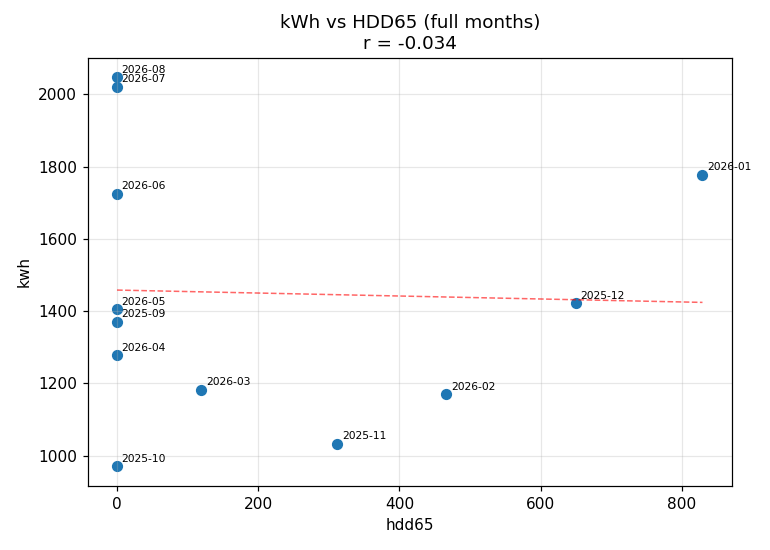
Heating-only view. Weak on its own — the heat pump only runs part of the winter.
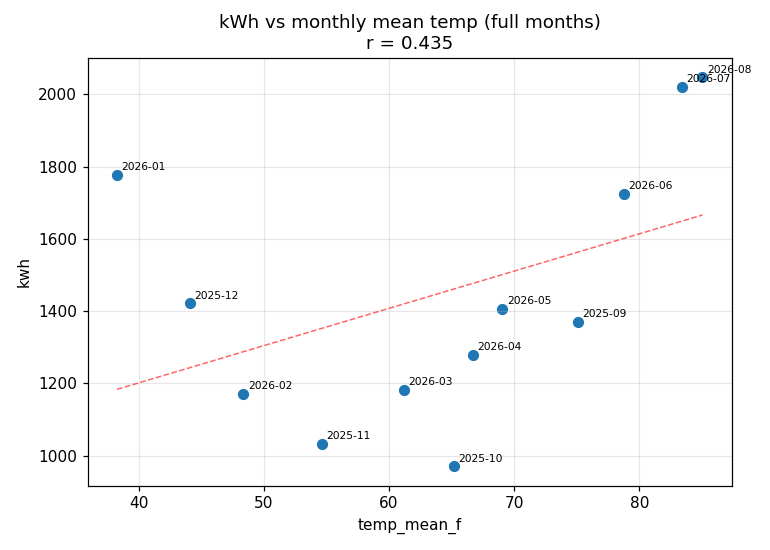
V-shape expected: high usage at both cold and hot extremes.
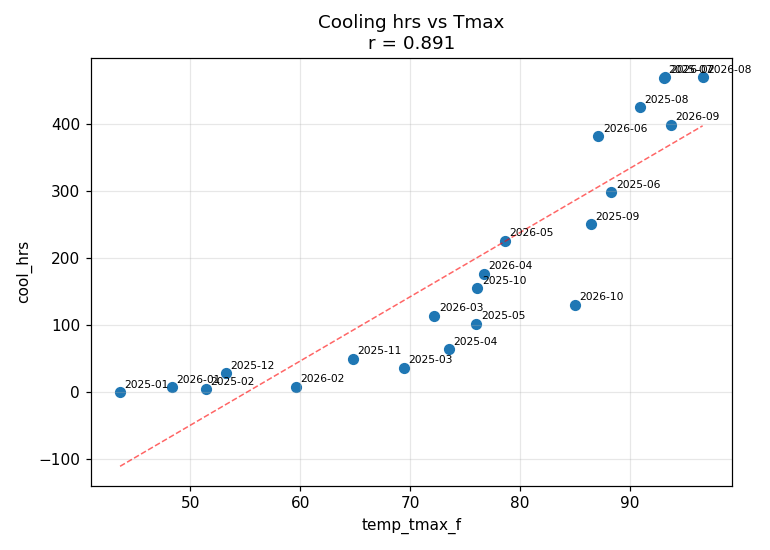
Runtime tracks peak outdoor temperature. r = 0.94.
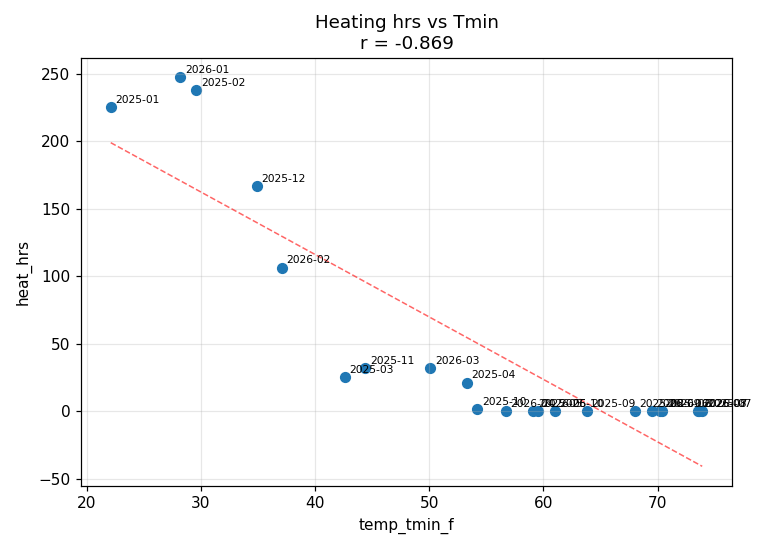
Runtime rises as overnight lows fall. r = −0.85.
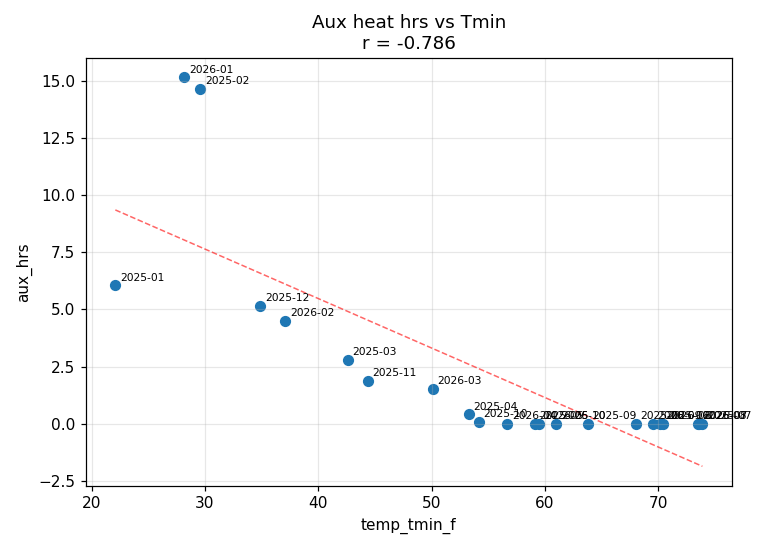
Resistive strip usage — expensive. Should shrink after earth tubes.
Raw data: runtimes_full.csv · view as table